The combination of transparent grids and digital imaging offers a rigorous method for converting biological activity into hard data. By overlaying a transparent grid with a standard square centimeter ($cm^2$) scale onto the honeycomb and capturing high-resolution images, you can transform the dynamic, chaotic movement of Apis cerana populations into calculable, static information. This technique allows for the precise measurement of bee density per unit area without disrupting the colony's natural behavior.
Core Takeaway: This approach bridges the gap between field observation and data science. It enables the non-invasive collection of empirical data, allowing researchers to calculate exact population densities and scientifically track colony growth trends based on standardized units of measurement.
Transforming Dynamic Behavior into Static Data
Overcoming the Challenge of Movement
Monitoring active bee colonies is inherently difficult due to the constant motion of the insects. Manual counting is often prone to error and estimation bias.
By utilizing high-resolution digital imaging, you freeze this motion at a specific point in time. This creates a static record that can be analyzed with precision rather than estimated in the moment.
The Function of the Grid Scale
The transparent grid serves as a critical standardization tool. It overlays a known metric ($cm^2$) directly onto the biological subject.
This converts an abstract image of a hive into a measurable map. It allows specific clusters of bees to be quantified mathematically based on the area they occupy.
Precision and Scientific Rigor
Empirical Density Calculation
The primary technical advantage of this method is the shift from qualitative observation to quantitative analysis.
Researchers can calculate the exact bee density per unit area. This provides a granular level of data that is essential for statistical analysis and rigorous scientific reporting.
Assessment of Growth Trends
Because the data is standardized via the $cm^2$ scale, measurements taken at different times are perfectly comparable.
This facilitates the scientific assessment of colony growth trends. You can objectively map the expansion or contraction of the population over specific intervals.
Preserving Colony Health During Observation
Minimizing Disturbance
Apis cerana can be sensitive to environmental changes and physical interference. Traditional counting methods often require prolonged hive exposure or physical manipulation of the frames.
This imaging technique is rapid and non-invasive. It captures the necessary data without requiring physical interaction with the bees themselves.
Maintaining Normal Activity
The transparency of the grid is a key feature. It allows for observation while minimizing visual obstruction or behavioral triggers for the bees.
This ensures that the data collected reflects the colony's normal state. The assessment process does not skew the results by causing stress or defensive behaviors.
Understanding the Trade-offs
Reliance on Image Quality
The integrity of your data is entirely dependent on the quality of your digital imaging.
Low resolution, poor lighting, or motion blur can render the grid lines illegible. This necessitates investment in capable camera equipment and proper lighting setups.
Analysis Latency
While data collection in the field is fast, the conversion of images to data occurs post-hoc.
You trade immediate, rough estimates for delayed, precise calculations. This method requires time allocated for image processing and analysis after the field work is complete.
Making the Right Choice for Your Research
If you are deciding whether to implement this grid-based imaging protocol, consider your specific objectives:
- If your primary focus is rigorous scientific publication: This method is essential as it provides verifiable, empirical data sets regarding population density.
- If your primary focus is colony welfare: This technique is ideal because it allows for deep analysis with minimal stress or disturbance to the Apis cerana hive.
By standardizing the visual data of the hive, you effectively turn subjective beekeeping observation into objective biological science.
Summary Table:
| Feature | Advantage | Benefit to Research |
|---|---|---|
| cm² Grid Scale | Standardized measurement | Converts visual hive data into calculable density metrics. |
| Digital Imaging | Static data capture | Freezes motion for error-free counting and permanent records. |
| Transparent Overlay | Non-invasive observation | Minimizes colony stress and preserves natural bee behavior. |
| Time-Series Analysis | Comparable datasets | Enables objective tracking of population growth and trends. |
Optimize Your Apiary with Precision Technology
At HONESTBEE, we understand that large-scale commercial beekeeping and professional distribution require the highest standards of data and efficiency. Whether you are managing vast Apis cerana populations or supplying the industry, our comprehensive wholesale portfolio is designed to elevate your operations.
How HONESTBEE adds value to your business:
- Advanced Machinery: From precision honey-filling to professional hive-making machines.
- Quality Hardware: A full spectrum of durable beekeeping tools and equipment built for longevity.
- Industry Consumables: Reliable supplies of all essential consumables for commercial apiaries.
- Cultural Merchandise: Unique honey-themed products to diversify your retail offerings.
Ready to scale your beekeeping business with professional-grade tools? Contact us today to discuss your wholesale needs and discover how our equipment can streamline your data collection and production.
References
- Z. Muhammad Shakir, D. Mohd Salleh. Honeybees, Apis cerana colony performance in the non-protected and protectedbeehive methods in relation to climatic factors. DOI: 10.26656/fr.2017.6(s1).002
This article is also based on technical information from HonestBee Knowledge Base .
Related Products
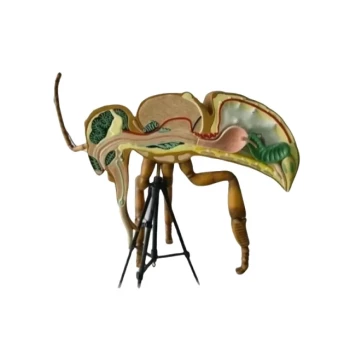
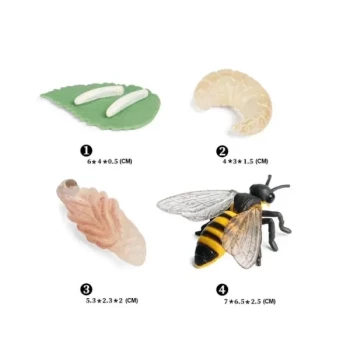
- Honey Bee Lifecycle Model: A Detailed Honeycomb Display of Bee Development
- Heavy-Duty Ergonomic Grip Galvanized Pollen Shovel
- HONESTBEE AC Powered Wire Embedder with Alligator Clips
- Solar Beeswax Melter Easy Solar Wax Melter for Beeswax
- Durable Plastic Hive Number Set for Beekeeping
People Also Ask
- Is it good to have honey bees in your yard? A Guide to Boosting Your Garden's Health
- What month do honey bees come out? Understand Their Spring Emergence & Activity Cycle
- Do winter bees exist in warmer climates? The Truth About Bee Adaptation in Mild Winters
- What should be considered when learning the behavior of honey bees and their queens? Master Colony Management
- Are honey bees good to have around? The Essential Role and Ecological Impact of Bees