Commercial apiaries can use hive sticky monitoring boards to measure Varroa destructor pressure by standardizing a short collection period, counting the mites that fall naturally, and converting the result into a daily mite-drop rate. A 24-hour count below approximately 6 mites in May, 10 in June, 16 in July, or 33 in August indicates comparatively stable infestation pressure under the stated Northern Hemisphere thresholds. Counts above the relevant seasonal threshold indicate elevated risk and should trigger immediate review of treatment needs.
Sticky boards are most useful as a trend-monitoring and treatment-timing tool. The value comes from consistent sampling across colonies and dates, not from treating one isolated count as a complete diagnosis.
How Sticky Boards Measure Varroa Pressure
Place the Board Beneath a Screened Floor
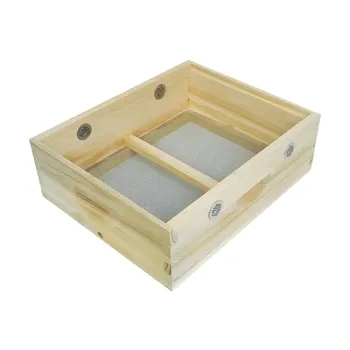
Install the adhesive board beneath the hive’s screened bottom board, with the sticky surface facing upward. A mesh layer, commonly around 1/8 inch, allows mites and debris to fall through while preventing bees from contacting the adhesive.
The board should be fitted securely so wind, hive vibration, and bee activity do not displace fallen mites. Grid-marked boards make counting faster and more consistent across a commercial apiary.
Collect Naturally Falling Mites
Varroa mites naturally detach from adult bees and brood and fall through the screen. The adhesive surface captures them before they can be removed by bees or lost through airflow.
This is a non-destructive assessment method. It allows managers to inspect infestation pressure without opening the brood nest extensively or sacrificing bees.
Use a Defined Sampling Period
For seasonal threshold comparisons, use a 24-hour collection period and record the total number of mites found. This produces a daily natural mite-drop count that can be compared directly with the monthly benchmarks.
Longer collection periods, such as several days or approximately one week, can be useful when mite numbers are low. However, the total must be divided by the number of collection days before comparing results with 24-hour thresholds.
How to Interpret Seasonal Counts
Compare Counts With the Relevant Month
Under the supplied Northern Hemisphere benchmarks, the following daily natural-drop levels indicate comparatively stable colonies:
- May: fewer than 6 mites per day
- June: fewer than 10 mites per day
- July: fewer than 16 mites per day
- August: fewer than 33 mites per day
These figures are operational reference points, not universal biological laws. Local climate, bee genetics, brood patterns, sampling conditions, and regional treatment guidance can change the appropriate action threshold.
Treat Exceeding Counts as an Intervention Signal
A count above the applicable seasonal threshold indicates that the colony is under elevated mite pressure and may face a substantially higher risk of late-season decline or collapse. Commercial managers should investigate the result promptly and select a control intervention compatible with the colony’s brood status, honey-production schedule, temperature, and local regulations.
The sticky-board result should guide urgency and prioritization. It should not be used by itself to determine the exact treatment product or dosage.
Track Trends Across the Apiary
Record the hive identification, apiary location, board installation and removal times, mite count, weather conditions, colony strength, and any treatments in progress. Repeating the same process across representative colonies allows managers to identify clusters of rising infestation.
A single high result warrants attention, while repeated increases across successive sampling dates provide stronger evidence that mite pressure is accelerating.
Building a Commercial Monitoring Program
Standardize Equipment and Handling
Use boards with a consistent adhesive surface, stable dimensions, and a contrasting grid or background that makes adult mites easy to identify. Standardized boards reduce counting variation between technicians and simplify comparisons between apiaries.
Maintain reliable supply of boards, screened components, replacement liners, and protective packaging. For distributors and commercial operators, dependable availability matters because missed monitoring windows can delay treatment decisions across hundreds or thousands of colonies.
Sample Representative Colonies
Testing every hive may be impractical in a large operation. Managers can sample a defined proportion of colonies from each yard, production group, queen line, or strength category, while giving additional attention to colonies with previous mite problems.
The sampling method should remain consistent throughout the season. Changing the selected colonies or collection periods makes apparent population changes harder to interpret.
Convert Multi-Day Counts Correctly
If a board remains in place for several days, calculate:
Daily mite drop = total mites counted ÷ number of collection days
For example, 30 mites collected over three complete days equals 10 mites per day. That result can then be compared with the appropriate seasonal benchmark.
A longer period can improve the visibility of low mite falls, but it should not be compared directly with a one-day threshold.
Use Additional Checks When Decisions Are High-Stakes
Natural mite fall provides useful surveillance, but it is an indirect measure. When a colony is near an economic threshold, when a treatment decision is disputed, or when a sticky-board result conflicts with colony symptoms, confirm the situation with another accepted monitoring method, such as an alcohol wash or powdered-sugar assessment where appropriate.
Combining methods is particularly valuable when boards are contaminated with debris or when bee activity, weather, or recent treatment may have altered mite fall.
Understanding the Trade-offs
Sticky Boards Are Low-Disruption but Indirect
The method avoids destructive sampling and can be deployed without substantially disturbing the colony. Its limitation is that the number of naturally fallen mites does not represent a direct count of all mites in the hive.
Natural drop can vary with brood emergence, colony behavior, weather, hive design, and recent treatment. A low count therefore means low observed fall during that sampling window, not proof that the colony is mite-free.
Longer Monitoring Increases Labor and Interpretation Risk
Leaving a board in place for several days may produce a more measurable total and reduce the effect of an unusually quiet 24-hour period. It also increases exposure to debris, moisture, ants, wax, and counting errors.
Longer sampling is appropriate only when the collection duration is recorded precisely and the result is normalized to mites per day.
Thresholds Are Not Universally Interchangeable
The 24-hour seasonal thresholds and the supplementary reference of 50 mites over 24 hours should not be combined as though they were one standard. They may reflect different management systems, regions, sampling conditions, or risk tolerances.
Commercial apiaries should select a documented threshold framework appropriate to their location and production calendar, then apply it consistently. Regional extension services, veterinarians, and applicable regulatory guidance should take precedence over generic figures.
Sticky Boards Do Not Replace Treatment Verification
A board can show that mites are falling, but it cannot by itself prove that a treatment has eliminated economically significant infestation. After treatment, managers should follow the product’s monitoring guidance and verify whether mite levels are declining over a suitable interval.
A continued high fall may indicate treatment failure, reinvasion from nearby colonies, an unsuitable application window, or an infestation level that requires a different management response.
How to Apply This to Your Apiary
Use a written protocol so field technicians collect comparable data from season to season.
- If your primary focus is early detection: Sample representative colonies on a fixed schedule, use 24-hour boards, and investigate counts above the applicable monthly threshold immediately.
- If your primary focus is large-scale labor efficiency: Use gridded sticky boards, standardized collection periods, and a central recording system so technicians can count quickly and compare yards reliably.
- If your primary focus is treatment timing: Monitor before and after major seasonal transitions, especially before autumn buildup, and use rising daily drop rates as a prompt for an integrated control decision.
- If your primary focus is treatment verification: Record the treatment date and compare normalized pre-treatment and post-treatment mite-drop rates, confirming unexpected results with a second monitoring method.
- If your primary focus is dependable procurement: Source boards, screened bottom-board components, replacement liners, and related supplies through a distributor able to provide consistent specifications, rapid response, and reliable fulfillment.
Used consistently, sticky monitoring boards turn natural Varroa fall into practical, season-long information for prioritizing colonies and acting before infestation becomes harder to control.
Summary Table:
| Month | Daily Mite-Drop Threshold (mites/day) |
|---|---|
| May | < 6 |
| June | < 10 |
| July | < 16 |
| August | < 33 |
Interpretation: Counts above the threshold indicate elevated risk and prompt action.
Ready to streamline your Varroa monitoring with high-quality sticky boards and beekeeping supplies? At HONESTBEE, we provide commercial apiaries and distributors with a one-stop sourcing solution for all your beekeeping needs. From precision sticky boards to full-spectrum equipment and rapid fulfillment, we support your operation's efficiency and profitability. Contact us today to discuss your requirements and discover how we can elevate your apiary management.
Related Products
- Australian Pine Wood Langstroth Screen Bottom Board for Wholesale
- Langstroth Solid Bottom Board for Beekeeping
- Langstroth Screen Bottom Board for Beekeeping Wholesale
- Solid Bottom Board Australian Pine Wood Langstroth Bottom Board for Wholesale
- Professional Beekeeping Quilt Box with Multi Vent Moisture Control
People Also Ask
- How are screen bottom boards and sticky boards utilized to detect Varroa mites? Master Passive Apiary Monitoring
- What is the primary function of a screen bottom board? Achieve Accurate Varroa Mite Assessment in Your Apiary
- Why is the combination of a screen bottom board and a sticky trap board essential for monitoring Varroa mite? Guide
- What is the primary function of a standard screen bottom board when assessing honeybee grooming behavior? - Key Mite Data
- What role do screen bottom boards and monitoring inserts play in assessing Varroa mite mortality and maintaining hive hygiene in Langstroth hives?